How to Monitor SQL Server Performance with Database Health Monitor
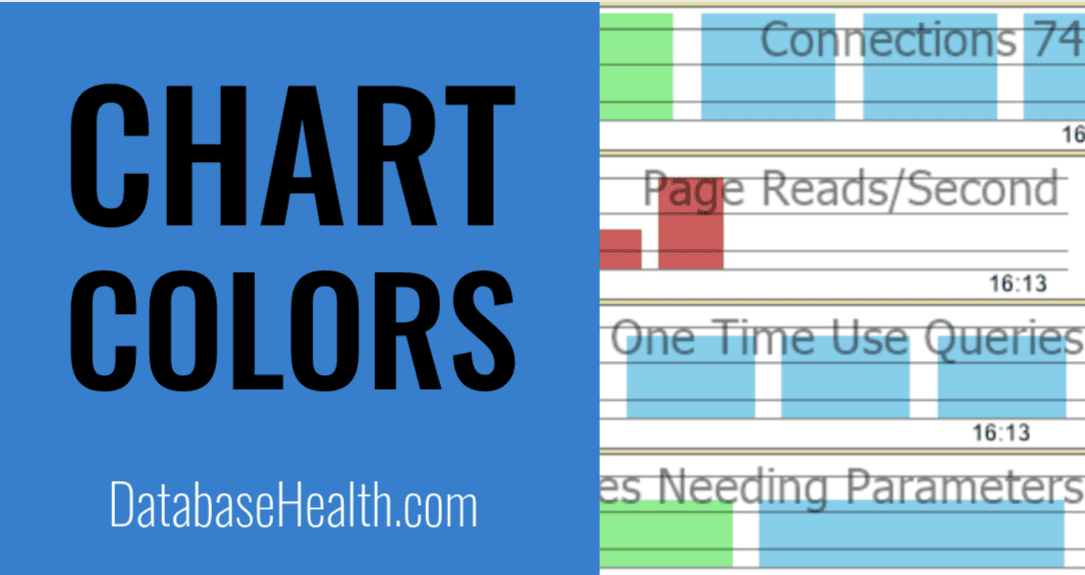
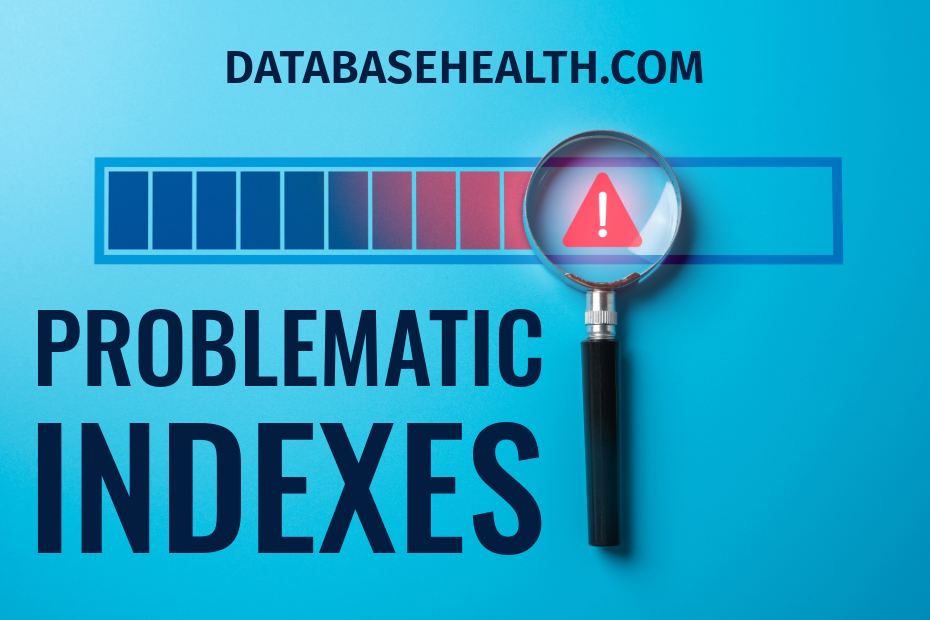
How to Monitor Database Performance with Database Health Monitor Ensuring that your SQL Server databases are running smoothly is critical for any organization. Consistent monitoring helps prevent performance issues before they escalate into bigger problems. One of the best tools available for this purpose is Database Health Monitor. It’s a free and comprehensive tool designed for real-time monitoring, performance analysis, and proactive diagnostics of SQL Server environments. In this post, we’ll guide you through the process of using Database Health …
How to Monitor SQL Server Performance with Database Health Monitor Read more »