Deadlocks by Object
Deadlocks by Object Report in Database Health Monitor
The Deadlocks by Object report in Database Health Monitor helps identify which database objects (tables, indexes, or views) are most frequently involved in deadlocks. This provides a clear picture of contention hotspots in your SQL Server environment, enabling you to prioritize optimization efforts.
Key Components of the Deadlocks by Object Report
- Visual Representation (Chart)
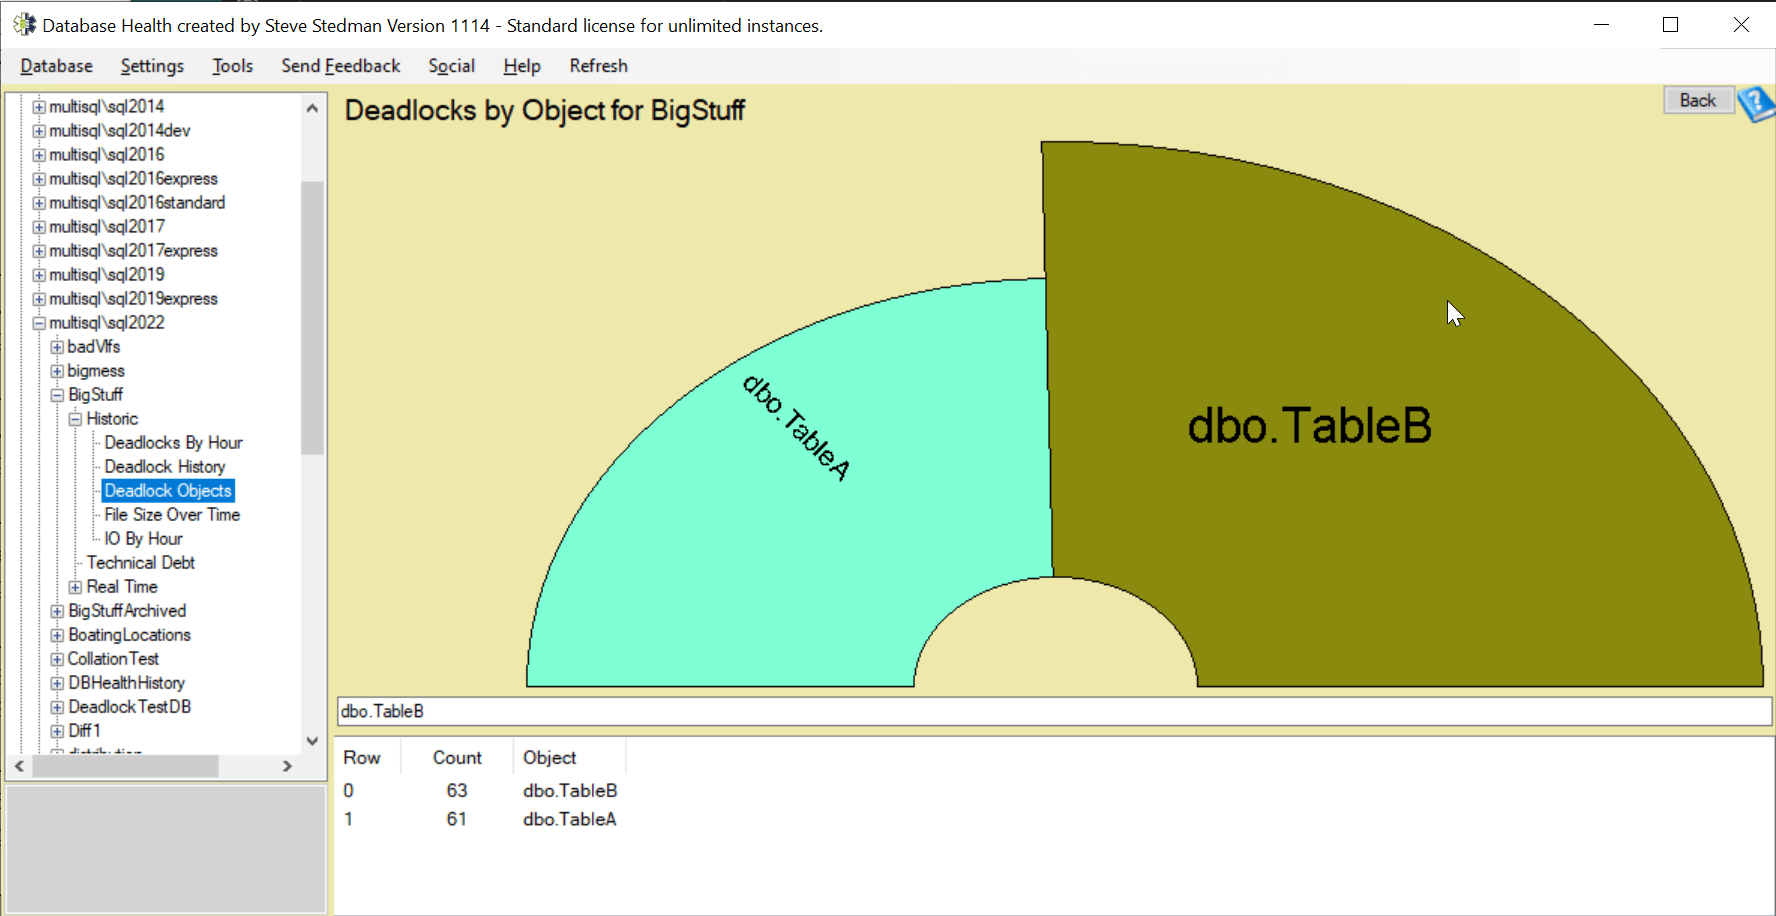
- The report presents a visual pie chart or bar graph showing the distribution of deadlocks across different database objects.
- In the provided image, the chart highlights that dbo.TableB and dbo.TableA are frequently involved in deadlocks.
- The size of each segment indicates the proportion of deadlocks attributed to each object. Larger segments indicate higher contention.
- Detailed Data Grid
- The table below the chart lists each object involved in deadlocks, along with the count of occurrences.
- In this example:
- dbo.TableB had 63 deadlocks.
- dbo.TableA had 61 deadlocks.
- Database Context
- The report is specific to a single database—in this case, the database named BigStuff.
- This allows you to narrow your focus to problem objects within a specific database.
How to Use the Deadlocks by Object Report
- Identify High-Contention Objects
- Focus on objects with the highest deadlock counts (e.g., dbo.TableB in this example).
- Determine whether these objects are being accessed by multiple concurrent transactions.
- Analyze Queries Involving These Objects
- Use the Deadlock History report or Extended Events to capture the specific queries causing deadlocks.
- Optimize query patterns that frequently access the problematic objects.
- Improve Indexing
- Ensure that the objects involved in deadlocks have appropriate indexes to minimize locking contention.
- Create covering indexes or filtered indexes to reduce the need for full table scans.
- Adjust Transaction Order
- Analyze whether transactions are accessing objects in a consistent order across all queries.
- Changing the order of resource access can prevent circular blocking that leads to deadlocks.
- Use Appropriate Isolation Levels
- If objects are heavily accessed, consider using Read Committed Snapshot Isolation (RCSI) to reduce locking.
- Example:
ALTER DATABASE BigStuff SET READ_COMMITTED_SNAPSHOT ON;
- Implement Application-Level Changes
- Implement retry logic in the application to gracefully handle deadlocks and attempt the transaction again after a brief delay.
Benefits of Using the Deadlocks by Object Report
- Pinpoints contention hotspots in your database.
- Helps prioritize optimization efforts based on actual deadlock frequency.
- Provides a visual summary for easier understanding and decision-making.
- Guides indexing, transaction order, and query improvements for better concurrency.
By using the Deadlocks by Object report, you can gain valuable insights into which objects are contributing most to deadlocks, allowing you to take proactive steps to reduce deadlock occurrences and improve overall database performance.
Need help with deadlock analysis or SQL Server performance tuning? Contact Stedman Solutions for expert assistance.