Waits by Type
Overview
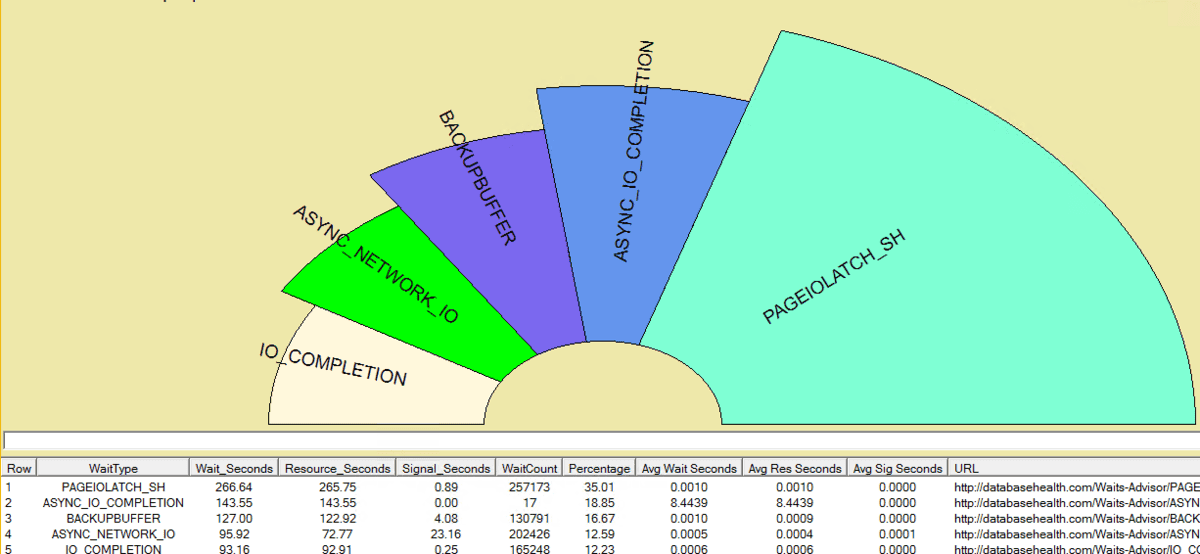
The Waits by Type report is the short answer to “what is this SQL Server waiting on?” It reads sys.dm_os_wait_stats once and shows:
- a pie chart with one slice per wait type, sized by its share of the total wait time,
- a grid with the same wait types, their wait time in seconds and their percent of the total.
Idle and background waits are left out before the percentages are worked out, so one sleeping system task cannot take most of the pie and make every real wait look small.
The report is opened with a database selected, and it connects with that database, but the numbers are not filtered to it. sys.dm_os_wait_stats is instance wide, so the page shows the waits of the whole instance since SQL Server started or since the wait statistics were last cleared. For the same data with categories, signal wait time and a budget strip, use the instance level Waits report. For waits split per query inside one database, use Waits by Query.
Where to find it
| Route | How |
|---|---|
| Overview drill through | A title named Waits on an overview page, handled by the overview label click handler, opens this report |
There is no tree node and no Instance Level Reports menu item for it. The Waits chart in the CPU and Waits panel of the current Server Overview opens the instance level Waits report instead, not this one.
While it loads, the title reads Waits by Type. Once the grid is shown, the page title reads WaitsByDatabase.
Which waits are shown
A wait type is included when all of these are true:
- it is not on the background wait list shared by every waits page in the application (the same list the Waits report uses). That list covers idle and system waits such as
CHECKPOINT_QUEUE,SP_SERVER_DIAGNOSTICS_SLEEP, the Query Store background waits and the Service Broker and mirroring queue waits, plus every wait whose name starts withSLEEP_orPARALLEL_REDO_, - its
wait_time_msis more than 1,000 (one second), - it is more than 1 percent of the total wait time of the waits that passed the two tests above.
The rows are sorted by wait time, largest first. The percentages are taken before the 1 percent cut, so the grid can add up to a little less than 100.
When nothing passes, the page shows There are no waits for the time selected.
Reading the grid
| Column | What it is |
|---|---|
| Row | The position of the wait, 1 for the largest. |
| Type | The wait type, as sys.dm_os_wait_stats names it. |
| Wait Seconds | wait_time_ms divided by 1,000, to two decimal places. |
| Percent | This wait’s share of the total wait time, to one decimal place. |
The grid exports to CSV and Excel like every other grid.
Reading the chart
The pie has one slice per row of the grid, sized by Percent and labeled with the wait type. Click a slice to open the Waits Advisor for that wait type, with its percentage.
Double click and right-click actions
Double click a row to go to the report that owns the wait’s category. When the category has nowhere to go (a benign wait), the double click opens the Waits Advisor instead.
Right-click a row for:
| Item | What it does |
|---|---|
| Investigate <wait type>: <report> | Opens the report for the wait’s category (see the table below). |
| Waits History for <category> waits | Opens Historic Waits filtered to the wait’s category. |
| Idle wait: nothing to investigate | Shown, disabled, in place of the two items above for a benign wait. |
| Waits Advisor for <wait type> | Opens the Waits Advisor for the wait and its percentage. |
Where each category goes:
| Category | Report |
|---|---|
| Locking | Blocking Tree |
| Latch | TempDB Metadata Contention |
| IO | I/O by Database |
| Transaction Log | I/O by Drive |
| Network | Connections |
| Parallelism | Parallelism Calibration |
| Memory | Memory Grants and Spills |
| CPU / Scheduler | Plan Regressions for the selected database, because this page has a database in hand |
| Benign | Nowhere (the idle wait line) |
| Any other category, and Unclassified | Waits |
How to read the report
- Look at the top two or three slices. Those are where the instance spends its waiting time.
- Remember it is cumulative. The numbers run from the last restart or the last clear of the wait statistics, so a heavy night weeks ago is still in them. Historic Waits shows waits over time.
- Double click the top wait to go to the report that explains its category, or right-click it for the Waits Advisor.
- Do not read it as one database. The waits are the whole instance’s, whichever database was selected.
Where the data comes from
A single query against sys.dm_os_wait_stats, with the background waits excluded in the query itself. Nothing is installed on the instance and nothing is written.
Requirements
- VIEW SERVER STATE on the instance, to read
sys.dm_os_wait_stats(VIEW SERVER PERFORMANCE STATE on SQL Server 2022 and later). - A connection to the selected database.
Related reports
- Waits – the instance level waits report, with categories and signal wait time.
- Waits by Query – waits split by query, from Query Store, for one database.
- Historic Waits – waits over time, from historic monitoring.
- Blocking Tree, I/O by Database, Memory Grants and Spills, Plan Regressions – where the drill through goes for the common categories.
Frequently asked questions
Why are these the same numbers whichever database I pick? Because sys.dm_os_wait_stats has no database column. The waits are the instance’s.
Why does the grid not add up to 100 percent? Waits under 1 percent of the total are left off the grid and the chart, but still count toward the total the percentages are taken from.
Why is a wait I expected missing? It is under one second in total, under 1 percent of the total, or on the background wait list.
How do I reset the numbers? The report does not reset anything. The wait statistics clear when SQL Server restarts, or when somebody runs DBCC SQLPERF('sys.dm_os_wait_stats', CLEAR).