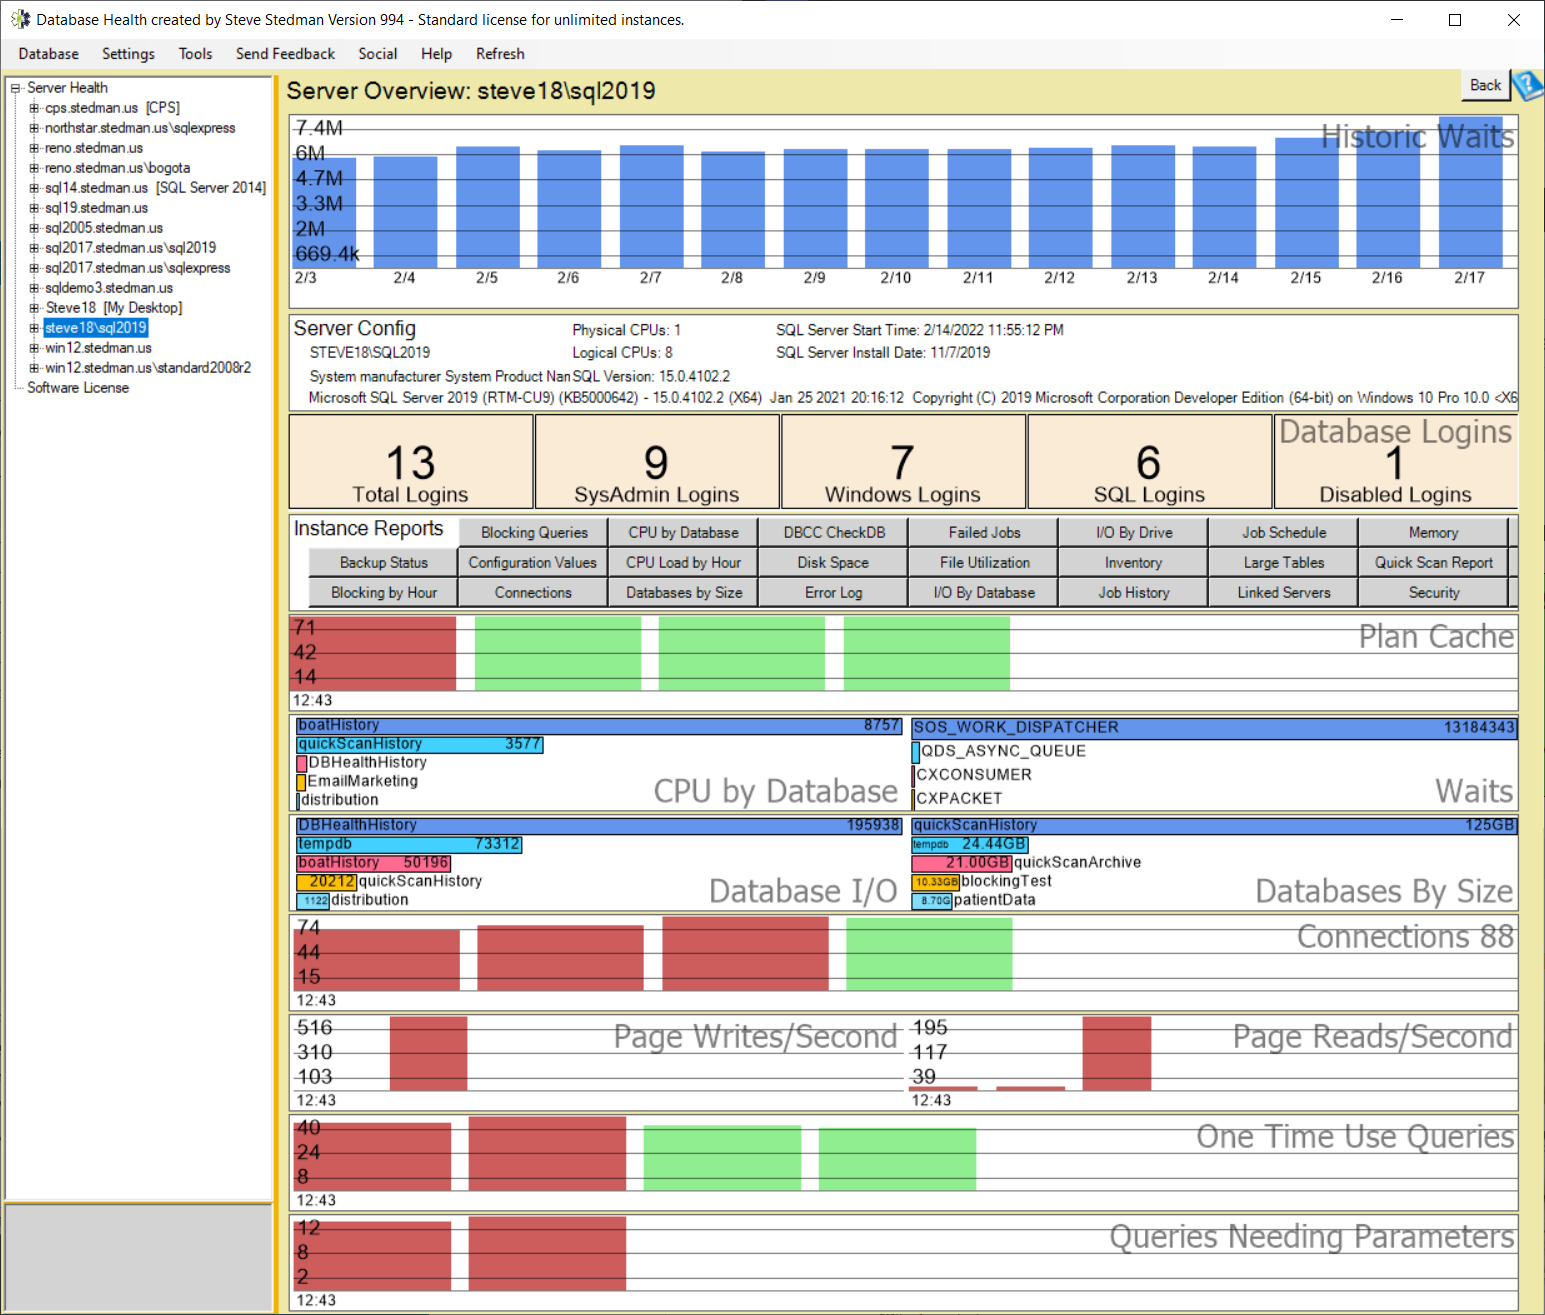
Server Overview
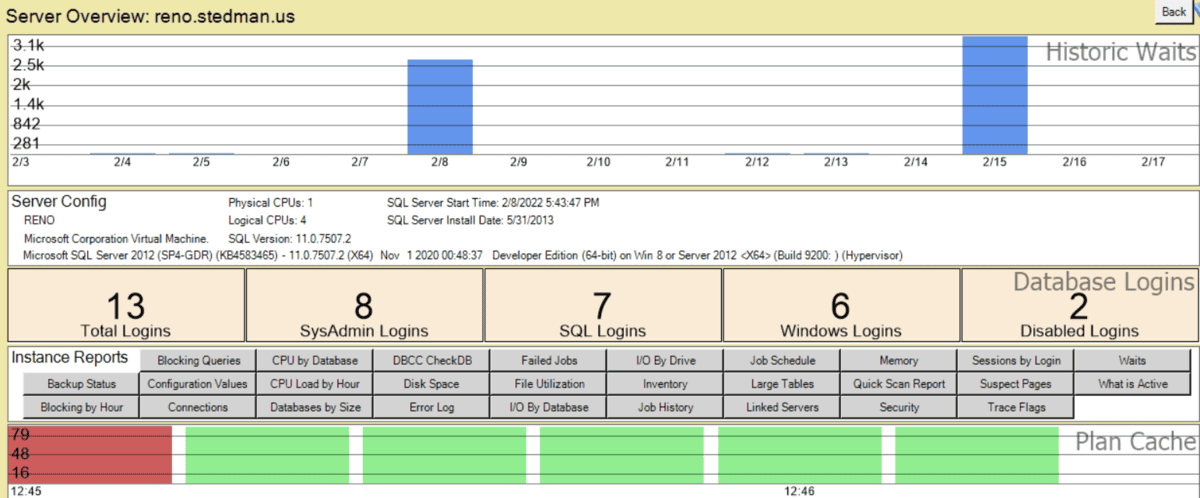
The Server Overview page in Database Health Monitor provides a high-level summary of a SQL Server instance, including key performance metrics, configuration details, login statistics, and database activity. Below is a breakdown of the information displayed on this page:
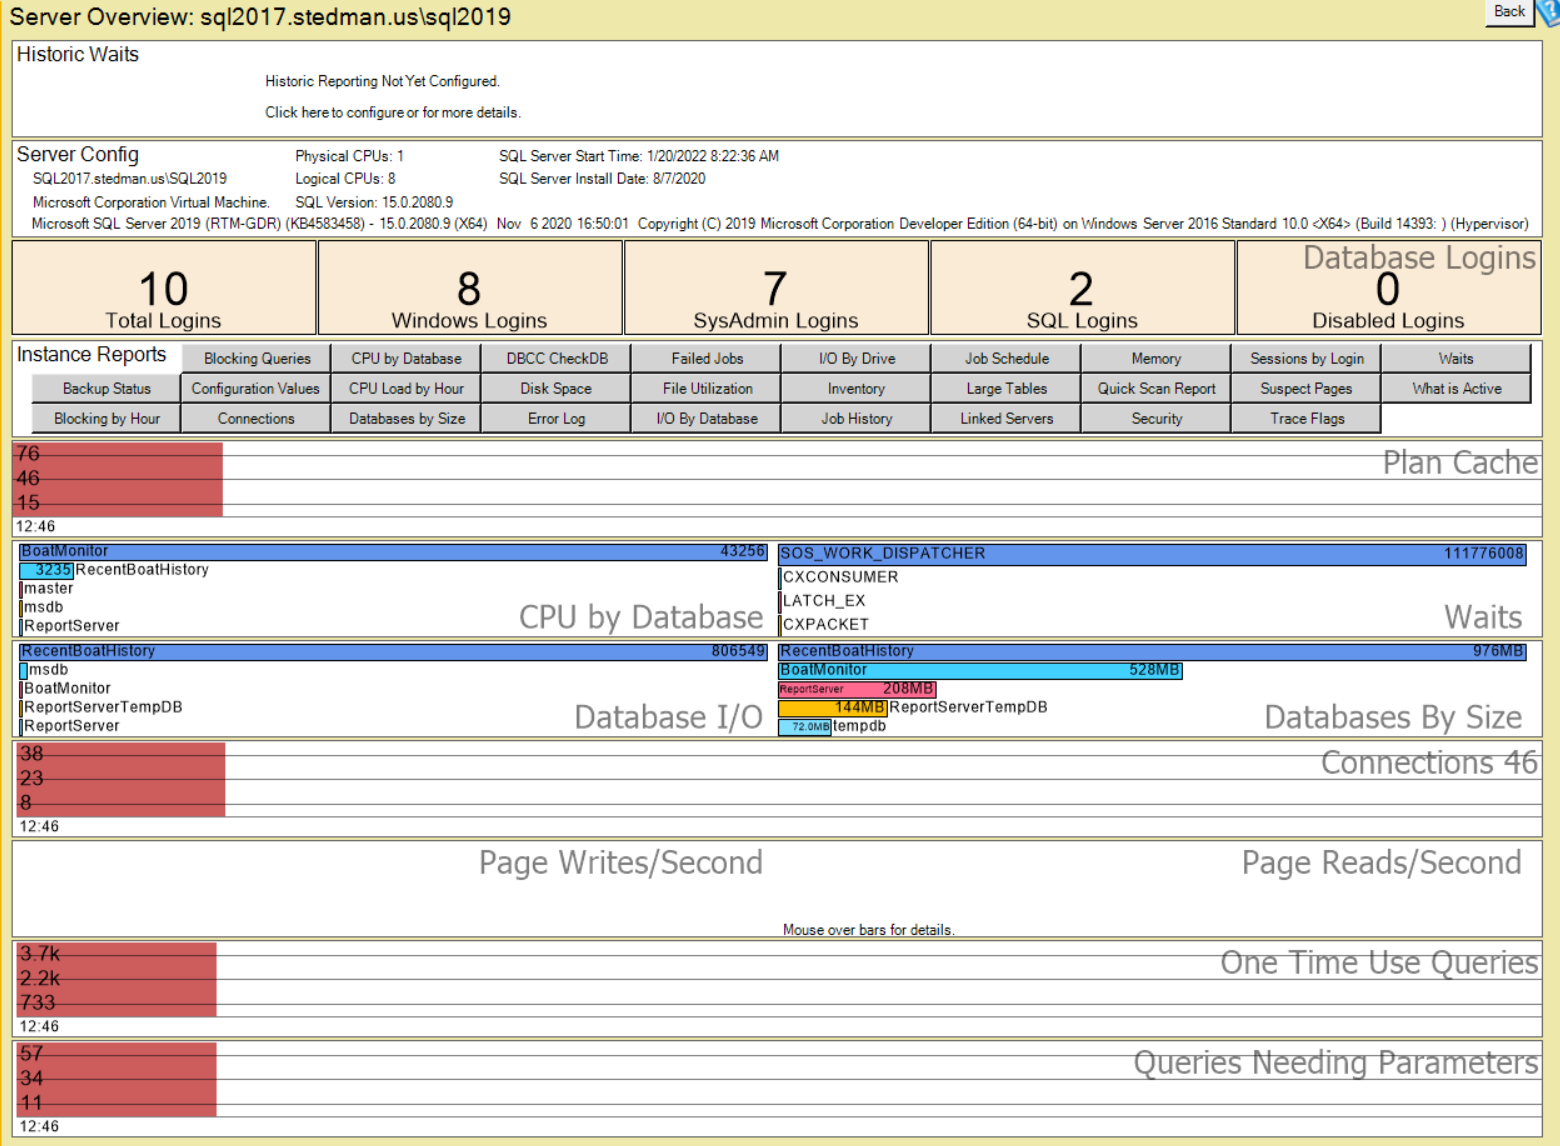
1. General Server Information:
- Server Name: Displays the SQL Server instance being monitored.
- SQL Server Version: Shows the installed SQL Server version, including service pack or cumulative update details.
- CPU Details: Lists both physical and logical CPU counts.
- SQL Server Start Time: Indicates when the SQL Server instance was last restarted.
- SQL Server Install Date: Shows the original installation date of SQL Server.
- Operating System Details: Displays the OS version and hypervisor information if applicable.
2. Login Statistics:
- Total Logins: The total number of logins configured on the instance.
- SysAdmin Logins: The number of logins with sysadmin privileges.
- SQL Logins: Logins that are SQL authentication-based.
- Windows Logins: Logins that are Windows authentication-based.
- Disabled Logins: Number of logins that are currently disabled.
3. Performance and Activity Reports:
- A collection of pre-built reports for quick analysis:
- Schema Search
- What is Active (real-time queries)
- DBCC CheckDB
- CPU by Database
- Deadlocks By DB
- Blocking Queries
- Performance History
- Backup Status
- Job History & Job Schedule
- Security & Trace Flags
- Waits & Configuration Values
- Failed Jobs
- Disk Space, Memory, I/O by Database
4. Historic Wait Statistics:
- A bar chart displaying historical wait statistics over a period of time, helping identify periods of high wait activity.
5. Blocking Queries & Active Queries:
- Displays active and blocking queries in real time, showing the number of blocked sessions.
6. CPU Usage by Database:
- A graphical representation of CPU utilization per database, helping pinpoint databases consuming excessive CPU.
7. Wait Statistics:
- Breakdown of wait types and their impact on performance, such as:
- SOS_WORK_DISPATCHER
- QDS_ASYNC_QUEUE
- LATCH_EX
8. Database I/O and Size:
- Database I/O: Highlights databases with the most read/write activity.
- Database Sizes: A visual representation of database sizes, helping identify storage usage.
Why Use This Page?
The Server Overview page in Database Health Monitor provides an easy-to-read dashboard for SQL Server health, performance, and security. It helps DBAs quickly assess issues such as CPU bottlenecks, excessive waits, login security risks, blocking queries, and disk space concerns.
For continuous monitoring and expert SQL Server support, consider Stedman Solutions’ Managed Services, which includes proactive database health monitoring and performance tuning.
The server overview page gives you a quick rundown of the following:
- Historic Waits
- Plan Cache
- CPU By Database
- Server Connections
- Page Writes / Second
- Page Reads / Second
- Waits
- One Time Use Queries
- Queries Needing Parameters
The gray buttons in the middle of the page are all the instance level reports. These report are some of the quickest ways to evaluate the overall status of your entire SQL Server.