Deadlocks By Hour For Database
Deadlocks by Hour for Database Report in Database Health Monitor
The Deadlocks by Hour for Database report in Database Health Monitor provides a visual breakdown of deadlocks occurring in a specific database over time. This report helps DBAs identify patterns, trends, and peak deadlock times, allowing for targeted troubleshooting and optimization.
Understanding the Deadlocks by Hour Report
- Database and Server Context
- The report is generated for a specific database on a specific SQL Server instance.
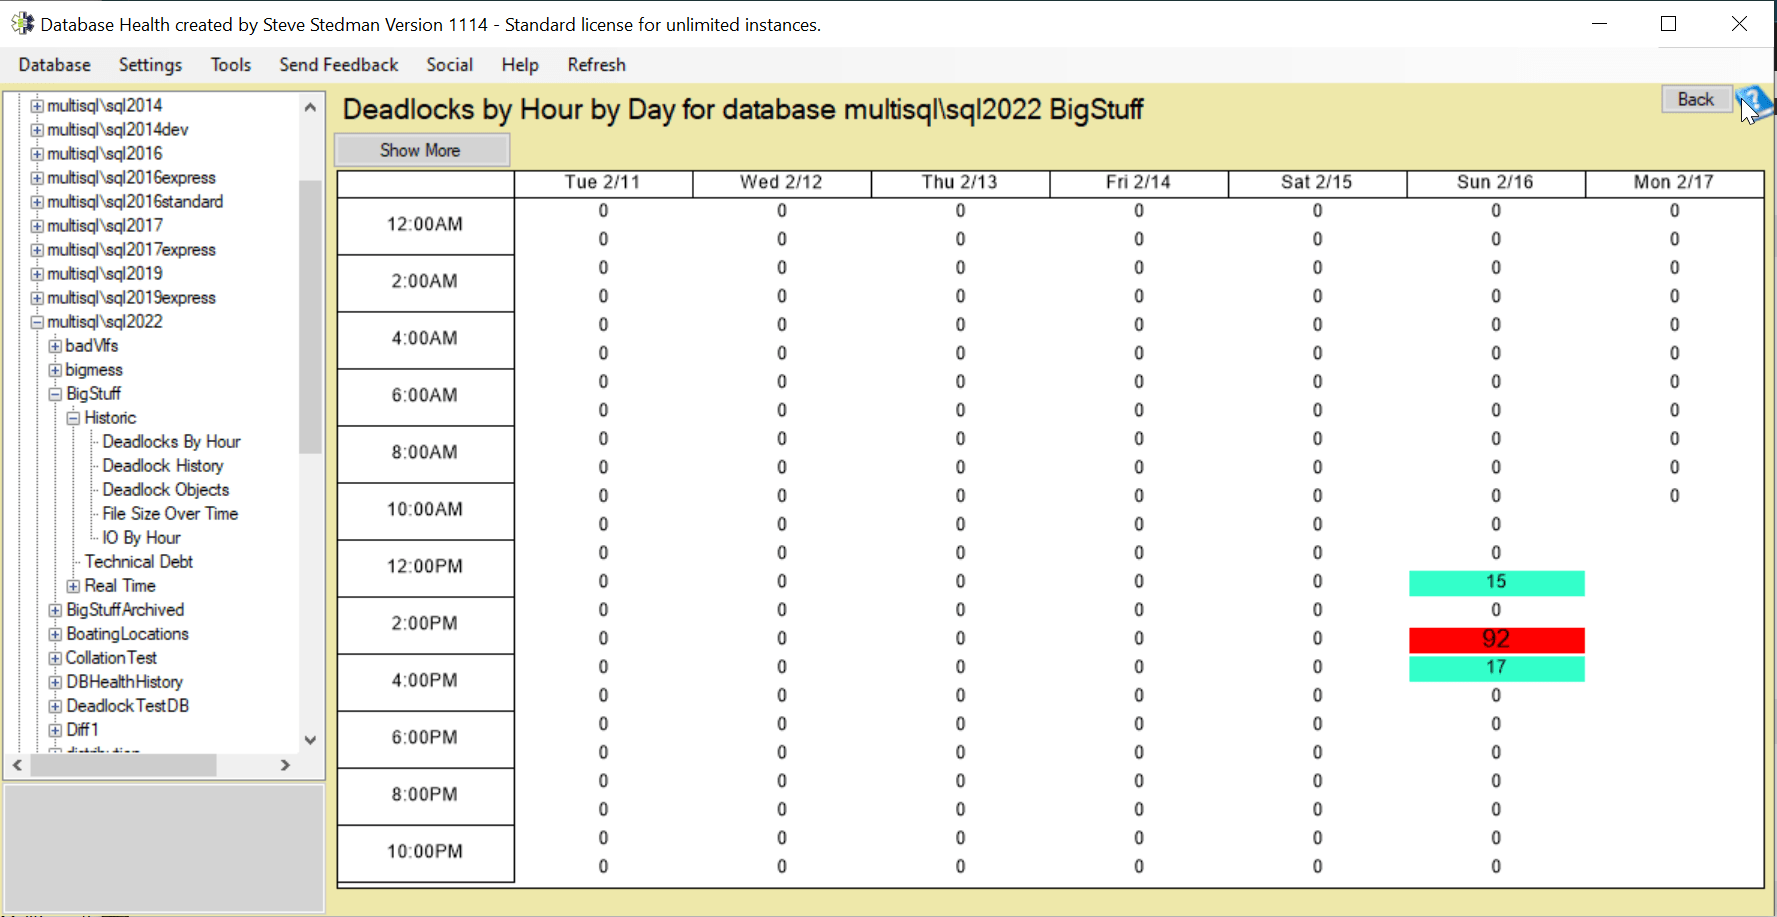
- In this example, it is analyzing deadlocks in the “BigStuff” database on multisql\sql2022.
- Grid Layout
- The columns represent dates (e.g., Tue 2/11, Wed 2/12, etc.).
- The rows represent hourly time slots (e.g., 12:00 AM, 2:00 AM, 4:00 AM, etc.).
- Each cell in the grid shows the number of deadlocks recorded at that hour on that day.
- Color Coding
- White (0 deadlocks) → No deadlocks occurred.
- Light Blue/Green → A moderate number of deadlocks occurred (e.g., 15, 17).
- Red → A high number of deadlocks occurred, indicating a severe contention issue (e.g., 92 deadlocks at 4:00 PM on 2/16).
- Trends and Insights
- Deadlocks were not present on most days.
- A major spike happened on Sunday, February 16, at 4:00 PM (92 deadlocks), followed by lower but still notable deadlocks at 2:00 PM (15 deadlocks) and 6:00 PM (17 deadlocks).
- This suggests that a specific workload or process running at that time is causing contention issues.
How to Use This Report for Troubleshooting
- Identify Peak Deadlock Times
- Use this report to find when deadlocks are happening.
- If deadlocks happen at the same time every day, investigate scheduled jobs, ETL processes, or application queries running during those periods.
- Check Queries and Transactions Running at Those Times
- Use Extended Events or SQL Profiler to capture queries running during peak deadlock periods.
- Example:
SELECT * FROM sys.dm_exec_requests WHERE blocking_session_id <> 0; - Identify queries with high lock contention and optimize them.
- Look for Blocking Issues
- If deadlocks occur frequently, check for long-running transactions that might be holding locks.
- Use:
SELECT * FROM sys.dm_tran_locks WHERE request_status = 'WAIT';
- Adjust Query and Index Strategies
- Ensure indexes support query patterns to avoid full table scans that can increase lock contention.
- Consider changing isolation levels to reduce locking, such as Read Committed Snapshot Isolation (RCSI).
- Investigate Application Locking Behavior
- If multiple transactions update tables in different orders, reorder them consistently to avoid circular blocking.
- Example:
BEGIN TRAN UPDATE TableA SET Value = 'X' WHERE ID = 1; UPDATE TableB SET Value = 'Y' WHERE ID = 1; COMMIT TRAN;
- Monitor Deadlocks in Real-Time
- The Real-Time Deadlock Monitoring feature in Database Health Monitor can help capture live deadlocks.
Conclusion
The Deadlocks by Hour for Database report in Database Health Monitor is a powerful tool for tracking when and how often deadlocks occur. By identifying peak deadlock times, analyzing conflicting queries, and optimizing transaction behavior, DBAs can reduce deadlocks and improve SQL Server performance and see our other tools, at schemadrift.com