Backup Status
Overview
Most backup reports answer when was the last backup? That is the wrong question. The question a DBA actually needs answered is how much data would I lose if this database failed right now, and what would I have to do to get it back?
The Backup Status report answers both.
For every database it works out the exposure – the amount of data at risk, measured in time – at every moment across a window, and draws it as one lane per database. Exposure climbs with every minute that passes and drops to nothing at every backup that actually protects the data. Drawn against time, that is a sawtooth:
- The peak of a lane is the worst data loss inside the window.
- The pitch of the teeth is the backup schedule, legible without opening SQL Agent.
- The ramp still climbing at the right-hand edge is your exposure at this instant.
Exposure is measured in time, never in bytes. Converting it to bytes would need a log generation rate nobody sampled.
The report also finds the faults that a “last backup date” column reports as healthy: a broken log chain, backups written to the null device, a full-recovery database that has never had a log backup, and a database whose only full backups are COPY_ONLY.
Where to find it
| Route | How |
|---|---|
| Server tree | Right-click the server → Instance Level Reports → Backup Status |
| Server Overview page | Click the Backup Status report link, or pick it from the report drop-down |
| Start page | The Backup Status button – opens the all-instances view |
| Related Links bar | From Disk Space Forecast, Failed Jobs, Database Files, Last DBCC Good, QuickScan and Backup Time Frames |
| Report arrows | Previous is What is Active, next is Blocking by Hour by Day |
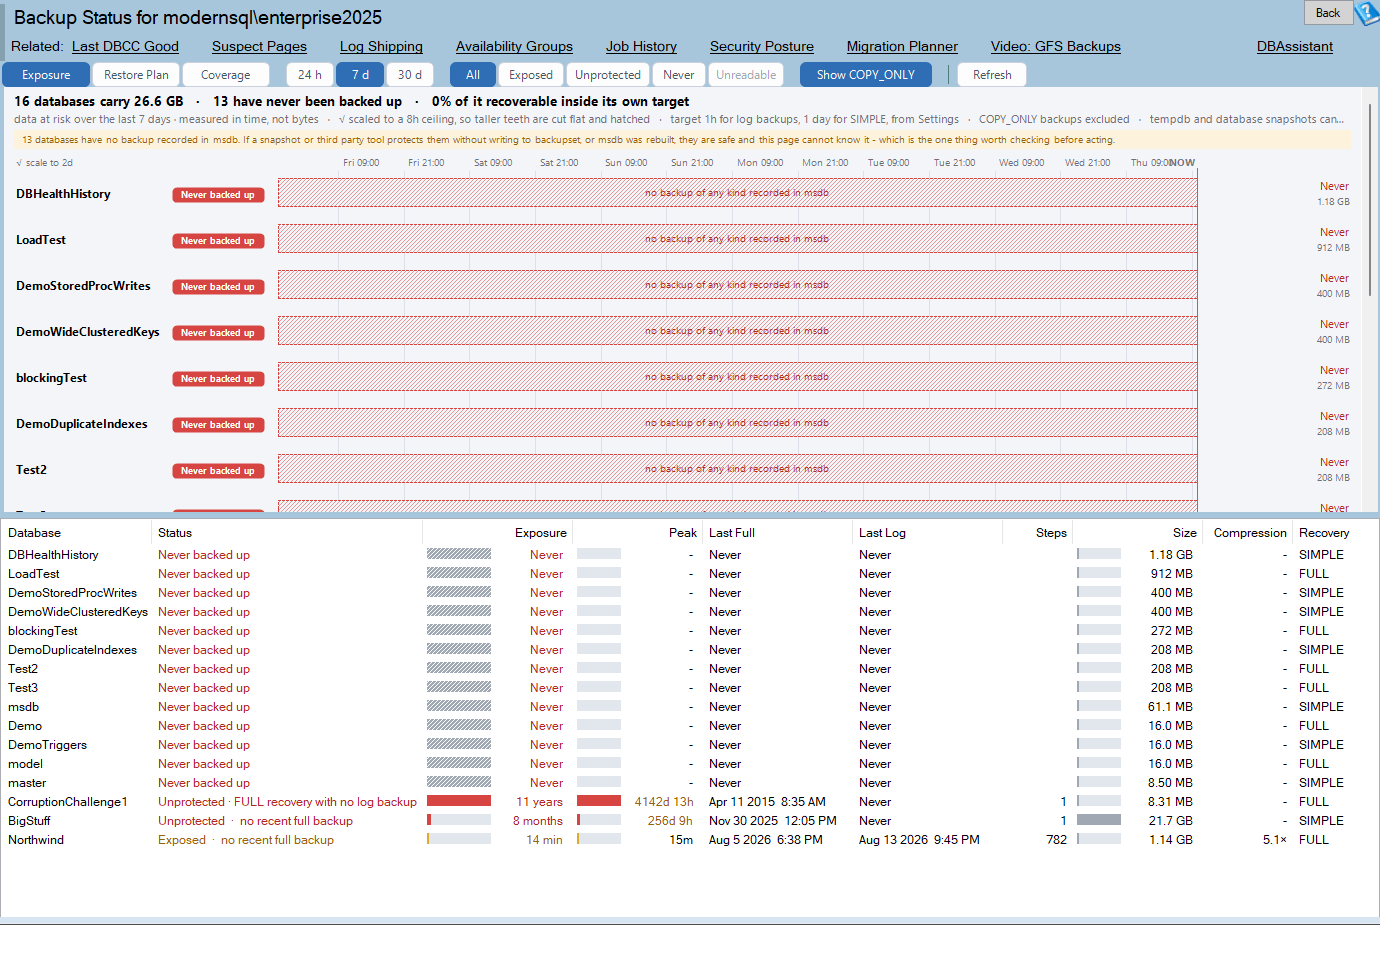
The page title reads Backup Status for <server name>. The help button opens https://databasehealth.com/server-overview/instance-level-reports/backup-status-report/.
The all-instances view
The Backup Status button on the start page opens Backup Status – All Instances, which runs the same query against every configured instance and puts the results in one grid with an Instance column added at the front.
That view deliberately has no chart – a lane chart of one instance sitting over rows from twelve of them would be describing something other than what is underneath it. It also has no toolbar, so the window, view and COPY_ONLY settings do not apply there.
If an instance could not be read, the page title says so:
Backup Status – All Instances · 2 instances could not be read: SQL02, SQL07
That matters on a backup page above all others. An instance that silently vanishes from a backup report reads as an instance with nothing wrong.
Requirements
sys.databasesandsys.master_filesare the hard requirement. Without them the page cannot list anything.- Read access to
msdbis what supplies every backup fact. It is probed rather than assumed – the report tries a single row frommsdb.dbo.backupsetand carries on either way. - The query timeout is 120 seconds.
msdb.dbo.backupseton a busy instance is a large table with a small index. - The batch runs on SQL Server 2008 and later. (The Log Chain Check script the right-click menu generates uses
LAGand needs 2012 or later.)
If msdb cannot be read, the report does not fail. Every database still lists with its state, size and recovery model, every backup fact is blank, and an amber notice band says plainly:
The backup history could not be read – this login has no access to msdb. Every database is listed with its state, size and recovery model, and nothing on this page about backups is an answer.
If the msdb read fails partway through, everything gathered so far is discarded rather than shown. Half an answer is worse than none on a backup page.
Because sys.databases is metadata-visibility filtered, a low-privilege login silently sees fewer databases than are really there.
Setting your targets
Three settings on the Thresholds tab of the Settings dialog decide how every database on this page is judged.
| Setting | Dialog label | Default |
|---|---|---|
BackupShowGreen |
Full backup fresh within (days) | 1 |
BackupShowRed |
Full backup overdue after (days) | 7 |
BackupLogRpoMinutes |
Log backup target, most data you can lose (minutes) | 60 |
The overdue value must be greater than the fresh value; if it is not, the report silently uses fresh + 1. The RPO is clamped between 1 minute and 7 days. The dialog stores whatever was typed, and a pair that ran backwards would band every database wrong.
Which target a database is judged against
| Recovery model | Target |
|---|---|
FULL and BULK_LOGGED |
The log backup RPO (default 60 minutes) |
SIMPLE |
The full backup cycle – the “fresh within” value in days |
SQL Server will not take a log backup of a SIMPLE database at all. Holding every SIMPLE database to a sixty-minute RPO would paint the whole page red and teach you to stop looking at the colour.
The bands
Exposure is compared with that database’s own target, not with one number for the whole instance.
| Band | Exposure | With the defaults, FULL recovery | With the defaults, SIMPLE |
|---|---|---|---|
| Protected (green) | within target | up to 1 hour | up to 1 day |
| Watch (light green) | up to 2× target | 1 – 2 hours | 1 – 2 days |
| Exposed (amber) | up to 8× target | 2 – 8 hours | 2 – 8 days |
| Unprotected (red) | beyond 8× target | over 8 hours | over 8 days |
| Never backed up (gray, hatched) | – | no backup of any kind recorded | |
| Unknown (gray, hollow) | – | could not be read |
Never backed up and Unknown wear a neutral gray rather than the far end of the red ramp, and are told apart by hatching. They are a different answer, not a worse one.
Faults that outrank the exposure figure
Four conditions force a database to Unprotected no matter how recent its last backup was. Every one of them is a case where a conventional “last backup date” report would show green.
| Condition | Why it is unprotected |
|---|---|
| Broken log chain | A gap between log LSNs inside the window. Log backups taken after the break cannot be applied. |
Last full written to NUL |
The backup finished, it is recorded in msdb, and there is no file anywhere to restore from. |
| FULL or BULK_LOGGED recovery with no log backup, ever | The single most common real backup fault there is. The log cannot reuse its space, and there is no point-in-time recovery. |
Every full backup is COPY_ONLY |
There is no differential base, so no differential can be restored. |
One more rule escalates a database to at least Exposed: a last full backup older than the “overdue after” setting. A perfect log cycle sitting on a full backup from two months ago is not protected – every one of those logs is useless without a full to apply them to, and the restore gets longer every day nobody takes one.
Databases handled specially
| Database | Treatment |
|---|---|
| tempdb | Excluded entirely. It is rebuilt at every startup and cannot be backed up. On the old page it sat in red forever, which is noise dressed as a finding. |
| Database snapshots | Excluded. A snapshot cannot be backed up either. |
| master, model, msdb | Treated exactly like user databases. No exemption. |
| Read-only databases | Kept. The old query filtered them out. A database nobody can back up is the row this page exists to surface. Flagged with a Read only note. |
| Offline, restoring, or not visible | Kept and drawn hollow, banded Unknown. A database that cannot be read is the row a DBA most wants to see. |
| A brand-new database with no backup | Still banded Never backed up, but noted as New 4h ago rather than accused. A database created this morning has not missed anything yet. |
| Third-party / VDI backups | Not penalised. Noted in the tooltip – the backup is real, it is just not sitting in a .bak anyone can find. |
Always On secondaries have no special handling. A non-readable secondary reports a state such as RESTORING and lands in Unknown. A readable secondary reports ONLINE and is judged against its own local msdb, which will not contain backups taken on the primary – so it can read as never backed up or badly exposed. Judge those rows on the primary.
The three views
The Exposure, Restore Plan and Coverage buttons are three drawings of one data set. Switching between them never goes back to the server.
Exposure (the default)
One lane per database, showing the sawtooth described in the overview.
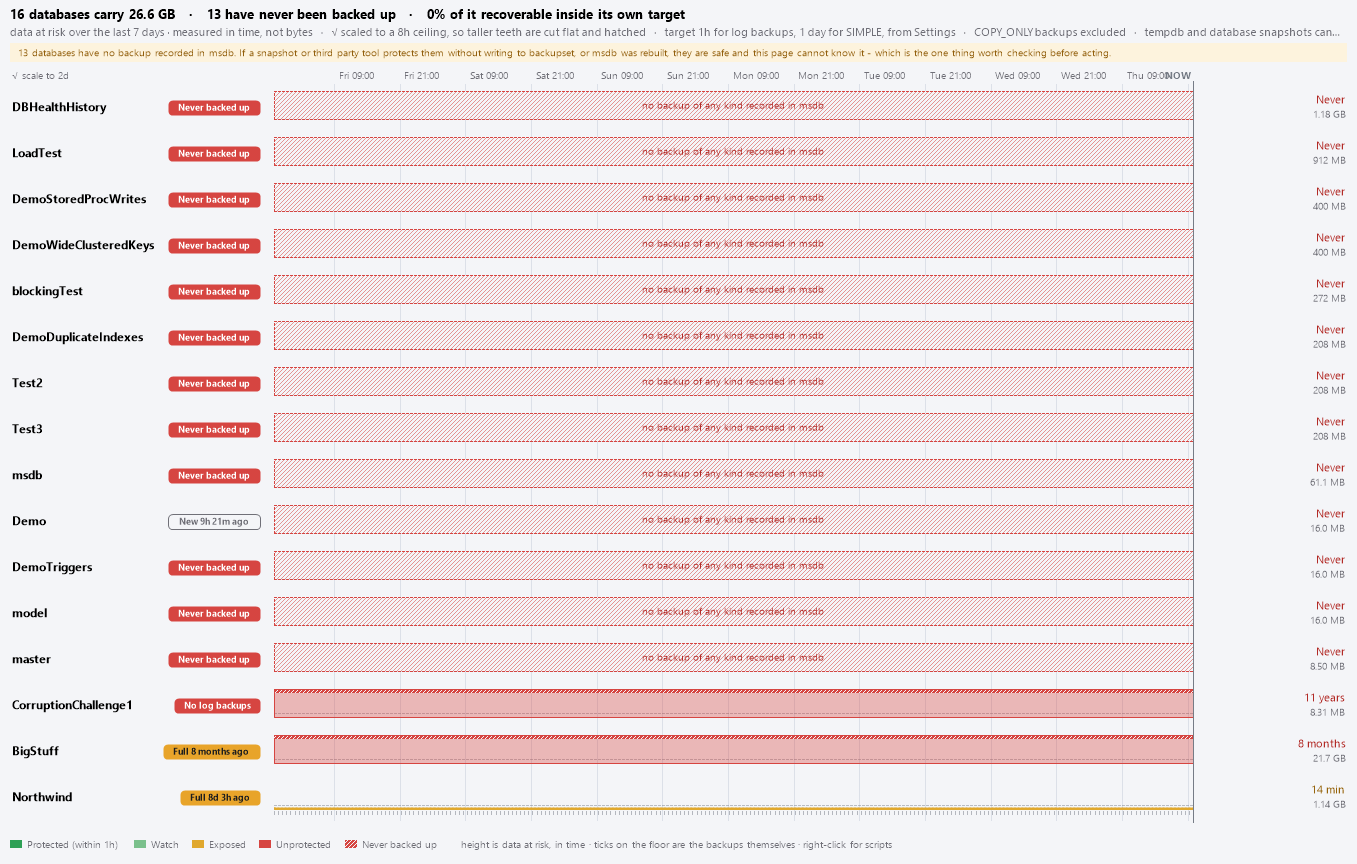
- The horizontal axis is time, with the right-hand edge marked
NOW– on the server’s clock, not your workstation’s. - The vertical axis is exposure in minutes, square-root scaled to a ceiling that is printed over the name column as, for example,
√ scale to 8h. Square-root scaling keeps the small teeth visible next to the large ones. - Gridlines are anchored on round clock boundaries – midnight, the top of the hour – not on “now”, so they line up with when things actually happened.
- A dashed line across every lane is your target. A number in a dialog nobody can picture becomes the line a tooth either stays under or does not.
- Backup ticks sit on the floor below each lane: a filled square for a full, a narrow bar for a differential, a hairline for a log backup. A full backup that is damaged or was written to
NULis drawn red; aCOPY_ONLYfull is struck through with a diagonal. - Where a tooth would exceed the ceiling, the top of that stretch is cut flat and hatched rather than the whole page being rescaled to accommodate one outlier.
- A dense run of backups is drawn as the flat envelope of a comb with a vertical hatch, so a solid block never reads as one long exposure.
- A chain break is a dashed vertical line labelled
✕ chain break. - A database that has never been backed up gets a hatched lane captioned no backup of any kind recorded in msdb.
- A database that could not be read gets a dotted hollow lane captioned nothing could be read for this database.
The legend reads: Protected (within 1h) · Watch · Exposed · Unprotected · Never backed up, followed by the hint height is data at risk, in time · ticks on the floor are the backups themselves · right-click for scripts.
Restore Plan
The same lanes redrawn as the restore you would actually run right now, and how many files it would take: a block for the full, a block for the differential if one applies, and a hatched run for the log backups, with any unprotected gap hatched separately.
The legend reads Full · Differential · Log backups · Unprotected gap, with the hint block width is time covered · right-click for the RESTORE script.
Chain continuity here is read from first_lsn and last_lsn, not from missing timestamps. A gap in the schedule is not the same thing as a gap in the chain.
Coverage
The same answer weighed by allocated size rather than by row count – one stacked horizontal bar across the full width, one segment per band, widths proportional to bytes.
Three tiny databases unprotected and one 4 TB database unprotected are the same number of rows and very different problems. This view is where that difference shows.
Clicking a segment filters the whole page to that band. Clicking it again clears the filter. This is the only way to filter to Protected or Watch, which have no toolbar button; when you do, a label on the toolbar reads showing protected only.
The header lines
The summary line, for example:
12 databases carry 480 GB · worst exposure is Sales at 9h 14m · 87% of it recoverable inside its own target
The middle clause escalates: if any database has never been backed up, it says that instead; if any has no recoverable backup, it names the largest one. The percentage is measured in bytes, not rows.
The subtitle line states the window, the target and the exclusions, for example:
data at risk over the last 7 days · measured in time, not bytes · √ scaled to a 8h ceiling, so taller teeth are cut flat and hatched · target 1h for log backups, 1 day for SIMPLE, from Settings · tempdb and database snapshots cannot be backed up
COPY_ONLY backups excluded is appended when that toggle is on.
The amber notice band appears when one thing needs saying above all others. In priority order:
- msdb could not be read.
- N databases have no backup recorded in msdb. If a snapshot or third party tool protects them without writing to backupset, or msdb was rebuilt, they are safe and this page cannot know it – which is the one thing worth checking before acting.
- N databases could not be read – offline, restoring, or not visible to this login. They are drawn hollow rather than left off the page.
- N databases have a broken log chain inside this window. Log backups taken after the break cannot be applied – take a full backup to start a new chain.
Chart interactions
| Gesture | Result |
|---|---|
| Hover a lane | Full tooltip (below) |
| Hover a coverage segment | Band name, count, bytes, share, and Click to show only these in the grid. |
| Left-click a lane | Selects the matching grid row and scrolls to it |
| Left-click a coverage segment | Filters the page to that band; click again to clear |
| Double-click a lane | Opens the Restore Sequence window for that database |
| Right-click a lane | The database menu, plus Copy Chart to Clipboard |
| Right-click empty space, header or legend | Copy Chart to Clipboard only |
The tooltip is the densest thing on the page:
Sales
Would lose 9h 14m of changes if it failed now.

Recovery FULL · read only
Target 1h (log backup RPO)
Size 412 GB

Last full 2026-08-04 22:00 (7h 15m ago) · COPY_ONLY
Last diff 2026-08-05 02:00 (3h 15m ago)
Last log 2026-08-05 05:00 (15 min ago)
Written to \\nas\bk\Sales_FULL.bak (+2 more files)
Compression 3.4× 118 GB on disk

In the last 7 days: 7 full, 6 diff, 672 log
Worst exposure in the window was 9h 14m.
A restore right now would be 41 files.

Click to find this database in the grid - right-click for scripts.
Extra paragraphs are appended when they apply – no log backup ever taken, the chain break time, a backup written to the null device, backups taken WITH CONTINUE_AFTER_ERROR, or a backup that came through the virtual device interface.
Copy Chart to Clipboard renders the whole chart at full height, not just the strip scrolled into view, and puts both a bitmap and a PNG on the clipboard.
Reading the grid
| Column | Units | What it is |
|---|---|---|
| Instance | – | All-instances view only. |
| Database | – | Database name. |
| Status | – | The plain-language verdict. See below. |
| Exposure | time | How much data would be lost if it failed now. Drawn with an in-cell bar. |
| Peak | time | The worst exposure reached anywhere in the window. Shares the Exposure bar scale. |
| Last Full | date | Last full backup, or Never. |
| Last Diff | date | Last differential backup, or Never. |
| Last Log | date | Last log backup, or Never. |
| Steps | count | How many files a restore right now would take. |
| Size | bytes | Allocated size of the database. Drawn with an in-cell bar. |
| Compression | ratio | Uncompressed ÷ compressed for the last full, or - when compression was off. |
| Recovery | – | SIMPLE, FULL or BULK_LOGGED. |

Unprotected is exactly what this report exists to surface.Exposure is measured from the newest recovery point – the latest of the last full, the last differential, and (for non-SIMPLE databases only) the last log backup. Backups written to NUL never count as a recovery point.
Rows are ordered by urgency, not alphabetically: Never backed up, then Unprotected, Exposed, Watch, Protected, and finally Unknown – and within each band by descending exposure, then by descending size. The worst thing on the instance is always the first row.
Status values
| Status | Meaning |
|---|---|
Protected / Watch / Exposed / Unprotected |
The band, from the exposure figure |
Never backed up |
No backup of any kind in msdb |
Unprotected · log chain broken Aug 3 14:20 |
LSN gap; logs after that point cannot be applied |
Unprotected · written to the null device |
The last full went to NUL |
Unprotected · FULL recovery with no log backup |
Never had a log backup |
Unprotected · every full backup is COPY_ONLY |
No differential base exists |
Unreadable · no access to msdb |
msdb could not be read |
Unreadable · RESTORING |
The database state, whatever it is |
A status may carry a suffix: · taken WITH CONTINUE_AFTER_ERROR or · no recent full backup.
Highlighting
- Exposure, Peak and Size draw an in-cell bar. Exposure and Peak share one scale, so a row whose peak dwarfs its current exposure shows two visibly different bar lengths – that is a schedule that recovered, not a database that is fine.
- The Exposure bar is hatched when the database was never backed up.
- Status and Exposure print in the band colour. Peak turns amber when it is more than twice the target.
Sorting, filtering and copying
- Click a column header to sort; click again to reverse. Exposure, Peak and Size sort on raw values. Never-backed-up rows sort past the end, not before the start.
- Right-click the grid for Copy, Copy with Headers (pastes into Excel), Select All, Filter ‘<column>’ and Reset Filters, followed by the database-specific items.
- Double-click a row to open the Restore Sequence window.
The toolbar
| Group | Buttons |
|---|---|
| View | Exposure · Restore Plan · Coverage |
| Window | 24 h · 7 d (default) · 30 d |
| Filter | All · Exposed · Unprotected · Never · Unreadable |
| Toggle | Ignore COPY_ONLY / Show COPY_ONLY |
Refresh |
- View changes never re-query.
- Window changes and the COPY_ONLY toggle do re-query.
- Filter buttons are client-side, and a filter button with no rows behind it disables itself – so the toolbar tells you at a glance whether you have any unprotected databases before you click anything.
There is no auto-refresh and no countdown. Backup status changes on the timescale of a backup schedule, not of a page refresh. Use Refresh when you want a new reading.
There is no Top N. Every database on the instance is shown.
Ignore COPY_ONLY
When on, COPY_ONLY backups are removed from the query entirely, so they neither lower the exposure curve nor count as protection. This is usually what you want: a COPY_ONLY backup somebody took by hand last Tuesday is not your backup strategy.
The report opens with this toggle on when reached from the server tree.
Right-click actions
Every item puts T-SQL on the clipboard and runs nothing. Taking a backup is a decision about where the file goes and how long it will take, which is not a menu item on a status page.
| Item | What it gives you |
|---|---|
| Show Restore Sequence… | Opens the restore sequence in a window |
| Open Backup Advisor (Restore Script)… | (only when a full backup exists) Opens the Backup Advisor on the newest backup, the same dialog as double-clicking a backup on the Backup Size report, with the restore chain and the restore script |
| Copy Database Name to Clipboard | Just the name |
| Copy BACKUP DATABASE Script to Clipboard | A full backup WITH INIT, CHECKSUM, COMPRESSION, STATS = 5, plus a RESTORE VERIFYONLY |
| Copy COPY_ONLY Backup Script to Clipboard | The same, WITH COPY_ONLY |
| Copy BACKUP DIFFERENTIAL Script to Clipboard | (only when a differential base exists) |
| Copy BACKUP LOG Script to Clipboard | (only for non-SIMPLE databases) |
| Copy RESTORE Sequence to Clipboard | The real sequence, built from msdb: every file named, with a MOVE for each database file |
| Copy Backup History Query to Clipboard | The whole msdb history for that database, newest first |
| Copy Log Chain Check to Clipboard | (non-SIMPLE only; needs SQL Server 2012+) Reproduces the report’s own chain-break finding |
| Copy SET RECOVERY SIMPLE Script to Clipboard | (only when FULL recovery has never had a log backup) |
| Copy Whole-Instance Log Backup Job to Clipboard | A cursor-based log backup for every eligible database, ready for a SQL Agent job |
| Copy Chart to Clipboard | (chart only) |
The restore sequence is built from what msdb actually recorded, with the real device paths for every backup in it: the full backup (and each stripe of it, if it was written to several files), the differential, and each log backup, in the order they are restored. It is the same script the Backup Advisor writes, so a MOVE is included for every database file, ready to point at another drive layout, and a log backup is restored with RESTORE LOG. It ends at the newest backup that is not COPY_ONLY. A header warns that msdb records where a backup was written, not whether the file is still there. If the chain is broken it says so at the top. If there is no full backup at all, it explains that and gives you the backup script instead.
Building it reads msdb again, on the instance the row came from, so it works from the all-instances page as well. If msdb cannot be read at that moment the script says so and falls back to the summary the page already holds, which names the full backup’s file but leaves the differential and log file names as placeholders.
The SET RECOVERY SIMPLE script is prefaced with four comment lines spelling out exactly what you are giving up, ending: If that is not acceptable, schedule log backups instead of running this.
How to read the report
- Read the notice band first. If msdb could not be read, nothing else on the page is an answer.
- Read the summary line. How many databases, how many bytes, and what share of those bytes is recoverable inside its own target.
- Look at the first row of the grid. Rows are ordered by urgency, so the worst thing on the instance is already at the top.
- Look at the Status column, not the dates. A recent
Last Fullwith a status ofUnprotected · written to the null deviceis the whole point of this report. - Look at the shape of the lanes. Even teeth are a schedule that is running. One long ramp is a schedule that is not.
- Compare Exposure with Peak. A low exposure with a high peak means something went wrong earlier in the window and then recovered. Worth knowing before it happens again.
- Switch to Coverage. Row counts and byte counts tell different stories. Coverage is the one you take to management.
- Switch to Restore Plan for anything that matters. A restore that takes 400 files is a different conversation from one that takes 3.
- Right-click and copy the restore sequence for your most important database, and read it. If you would not want to run it, you have found something.
Common patterns
A database with a recent log backup every 15 minutes and a status of Unprotected. Look for the chain break, the NUL device, or a full backup that is months old. All three produce exactly this.
Everything green except one hollow gray lane. A database that is offline or restoring. It is drawn rather than dropped precisely so you notice it.
A lane whose teeth stop partway across and become one long ramp. The backup schedule stopped running at that point. The x-axis tells you when.
A SIMPLE database sitting in Watch. Judged against the full-backup cycle rather than the log RPO. If it holds data you care about, it should probably not be SIMPLE.
Exposure much smaller than Peak on many lanes. The schedule works but has a gap in it – often a nightly window where log backups pause for the full.
A huge database in the amber segment of the Coverage bar. One row, most of your risk. This is why Coverage exists.
Where the data comes from
The report runs one query per load against the monitored instance, on a connection outside the pool. Nothing is stored and nothing is written.
sys.databases– name, state, recovery model, read-only and snapshot flags.sys.master_files– allocated size, and log size.msdb.dbo.backupset– every backup fact, including LSNs, sizes,is_damaged,has_backup_checksumsandis_copy_only.msdb.dbo.backupmediafamily– where each backup was written, and how many files it was striped across.
Everything is read WITH (NOLOCK) under READ UNCOMMITTED.
One caveat the report owns up to: msdb is joined by database name, not by database id. A database dropped and recreated under the same name inherits the old one’s backup history. There is no way around that – it is how msdb records the relationship.
The window buttons control how much detail is drawn, but the per-database summary figures – last full, last differential, last log – are computed over all recorded history, not just the window. A database last backed up two years ago still reports that date on the 24-hour window.
Settings
| Setting | Default | Values | Set by |
|---|---|---|---|
BackupExposureView |
exposure |
exposure, restore, coverage |
The view buttons |
BackupExposureWindowHours |
168 |
24, 168, 720 |
The window buttons |
BackupShowGreen |
1 |
days, minimum 1 | Settings dialog, Thresholds tab |
BackupShowRed |
7 |
days, must exceed fresh | Settings dialog, Thresholds tab |
BackupLogRpoMinutes |
60 |
1 – 10080 minutes | Settings dialog, Thresholds tab |
Messages you may see
No databases readable:
No databases could be read on this instance. This needs to see sys.databases. The backup history itself comes from msdb.dbo.backupset, and the page still works without access to that – it just cannot say anything about backups.
The query timed out:
The backup history did not come back in time. msdb.dbo.backupset grows without bound unless something prunes it, and on an instance where nobody ever has, reading a month of it takes a while. Try the 24 hour window, or run sp_delete_backuphistory.
In the chart: Nothing to show. or, in Coverage view, No allocated size could be read for these databases.
Related reports
| Report | Why you would go there |
|---|---|
| Last DBCC CheckDB Known Good | A backup of a corrupt database is a corrupt backup. |
| Suspect Pages | Known corruption, which changes what a restore is for. |
| Log Shipping | Where log backups are part of a shipping chain. |
| Job History | Why the backup job stopped running. |
| Security | Who can take and restore backups. |
| Migration Planner | What a new server needs, and how long the cutover would take. |
Frequently asked questions
Why is a database red when it was backed up an hour ago? Look at the Status column. A recent backup does not help if the log chain is broken, the backup went to NUL, every full is COPY_ONLY, or the last real full backup is months old. Those four override the exposure figure.
Why is tempdb not listed? It cannot be backed up. It is rebuilt at every startup. Showing it in red forever is noise dressed as a finding.
Why is a read-only database listed? Because a database nobody can back up is exactly the row this page exists to surface.
Why does an Always On secondary look unprotected? It is judged against its own local msdb, which does not contain the backups taken on the primary. Check backup status on the primary replica.
Why is exposure measured in time rather than in gigabytes? Converting it to bytes would need a log generation rate that nobody sampled. Time is the number you actually agreed with the business.
What does the hatching on a lane mean? Vertical hatch on the waveform means a dense run of backups drawn as an envelope. Diagonal hatch across a whole lane means never backed up. A hatched cap along the top of a tooth means the tooth exceeded the chart ceiling and was cut flat.
What does a struck-through square on the floor mean? A COPY_ONLY full backup. A red square is a full backup that was damaged or written to the null device.
Why does the report not refresh itself? Backup status changes on the timescale of a backup schedule. Use Refresh.
Can it take a backup for me? No. Every menu item copies a script to the clipboard and runs nothing. Taking a backup is a decision about where the file goes and how long it will take.