IO by Hour by Day
The IO by Hour by Day Report provides a breakdown of disk input/output (I/O) activity for a specific SQL Server database over time. This report helps database administrators identify usage patterns, peak I/O times, and potential performance bottlenecks.
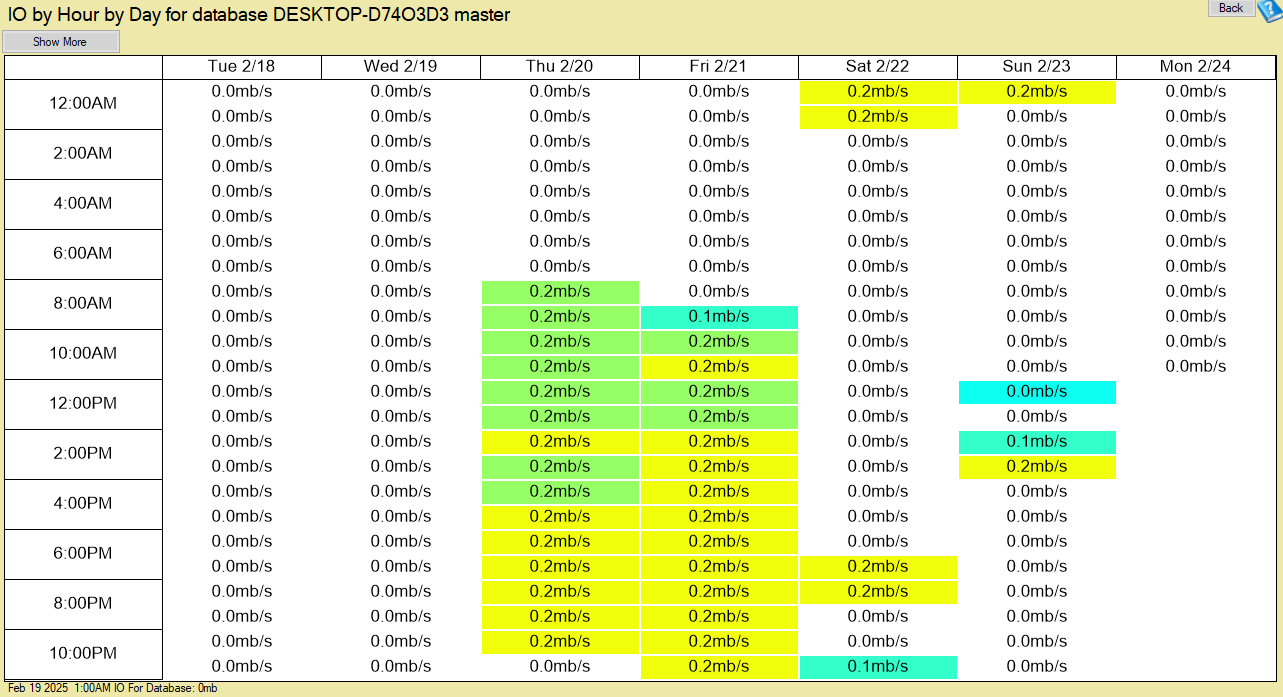
IO Activity Heatmap
- Displays database I/O activity across different hours of the day and days of the week.
- Each cell represents the I/O throughput for a given hour.
Data Table
Each row represents a specific hour of the day, and each column represents a different day.
| Column | Description |
|---|---|
| Hour | The hour of the day when the I/O activity was recorded. |
| Daily Columns | Each day of the week shows I/O rates at the specified hour. |
| I/O Rate (mb/s) | The amount of data read/written per second for each hour. |
Understanding the IO by Hour by Day Report
- Identify Peak Usage Hours – Look for time periods with consistently high I/O activity to optimize queries and indexing strategies.
- Detect Unusual Spikes – If I/O suddenly increases at an unexpected time, investigate background processes, jobs, or queries.
- Monitor Weekend vs. Weekday Patterns – Some databases show different activity levels based on business hours and scheduled maintenance.
- Check for Consistent Low Activity – If a database shows little to no I/O, verify if it’s underutilized or experiencing performance constraints.
Recommended Actions for IO by Hour by Day report
- Optimize High-Usage Hours – Consider scheduling intensive operations during low-traffic periods.
- Investigate Spikes – Check if unexpected I/O spikes are due to poorly optimized queries or maintenance tasks.
- Monitor Disk Performance – Ensure the underlying storage system can handle peak I/O demands without slowdowns.
- Adjust Indexing & Caching Strategies – Optimize frequently accessed data to reduce unnecessary disk reads/writes.
For expert assistance in SQL Server performance tuning, storage optimization, and monitoring, consider Stedman Solutions’ Managed Services.
Contact us for a free 30 minute consultation.