Blocking by Hour Report
Uncover SQL Server Performance Bottlenecks with the Blocking by Hour Report in Database Health Monitor
SQL Server performance issues can cripple your applications, frustrate users, and disrupt business operations. One common culprit? Blocking, where one database process holds a resource, causing others to wait. Identifying when and why blocking occurs is critical for maintaining a healthy SQL Server environment. That’s where the Blocking by Hour Report in Database Health Monitor, developed by Stedman Solutions, comes in—a powerful tool to pinpoint blocking trends and optimize your database performance.
What Is the Blocking by Hour Report?
The Blocking by Hour Report is an instance-level report in Database Health Monitor that provides a visual breakdown of blocking activity across your SQL Server instance over a specified time period. By displaying blocking data by hour and day, this report helps DBAs identify patterns and peak times when blocking is most severe, enabling targeted troubleshooting and optimization. For example, you can see if blocking spikes during specific hours due to scheduled jobs, ETL processes, or heavy application queries.
How the Report Works
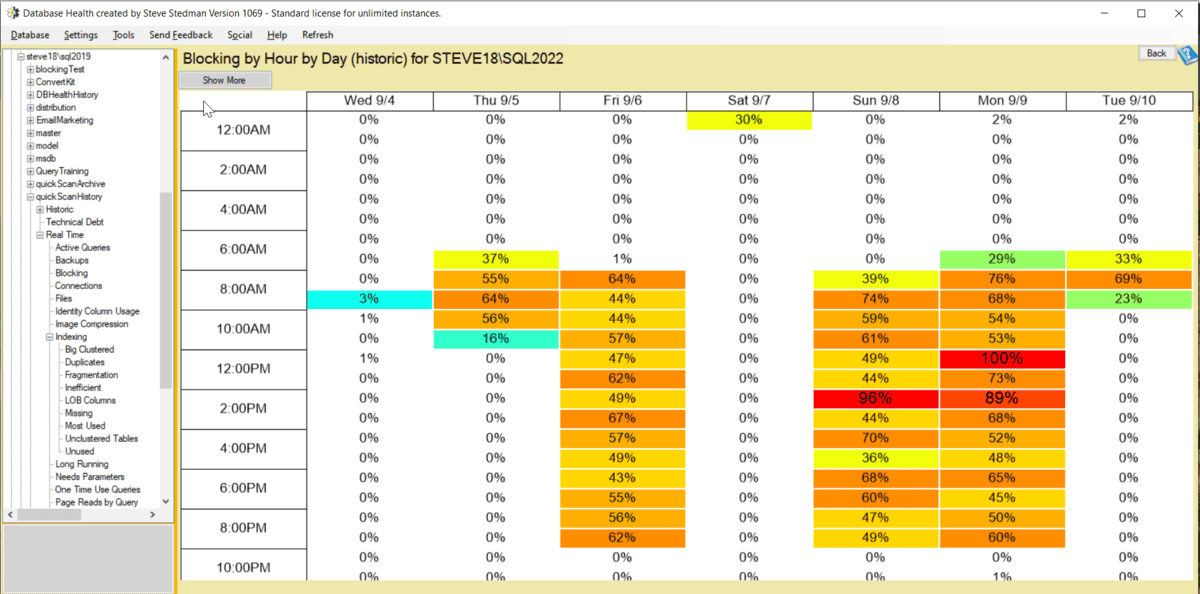
The Blocking by Hour Report presents data in a grid format, with columns representing dates (e.g., Mon 5/19, Tue 5/20) and rows representing hourly time slots (e.g., 12:00 AM, 2:00 AM). Each cell shows the relative amount of blocking for that hour, expressed as a percentage of the maximum blocking observed in the selected period. For instance:
- 100% indicates the hour with the most blocking activity.
- 50% means the hour had half the blocking of the peak hour.
- 0% indicates minimal or no blocking (less than 0.5% of the maximum).
This relative scale helps you quickly identify problem hours without getting bogged down in raw numbers. To use the report, you must enable Historic Monitoring in Database Health Monitor, which stores performance data in the DBHealthHistory database for trend analysis. You can adjust the report to show 1, 2, 3, or even 4 weeks of data to spot recurring patterns.
Why Blocking Matters
Blocking occurs when one SQL Server process locks a resource (e.g., a table or row), forcing other processes to wait. While locking is a normal mechanism to ensure data integrity, excessive or prolonged blocking can lead to slow queries, application timeouts, and user complaints. Common causes include long-running transactions, poorly optimized queries, or inadequate indexing. The Blocking by Hour Report helps you answer critical questions:
- When does blocking peak in my SQL Server instance?
- Are specific times of day consistently problematic?
- Could scheduled jobs or ETL processes be contributing to blocking?
Using the Blocking by Hour Report to Optimize Performance
Once you identify peak blocking times, you can take targeted actions to reduce contention and improve performance. Here’s how to leverage the report:
- Identify Peak Blocking Hours: Use the report to pinpoint hours with high blocking percentages (e.g., 100% or close). For example, if blocking spikes at 2:00 AM daily, investigate scheduled jobs or batch processes running at that time.
- Analyze Blocking Queries: Drill down using Database Health Monitor‘s Blocking Queries page, which lists active blocking and blocked sessions, including the SPID of the root blocker. You can also use Extended Events or queries like
SELECT * FROM sys.dm_exec_requests WHERE blocking_session_id <> 0;to capture real-time query details. - Optimize Transactions: Check for long-running transactions holding locks with
SELECT * FROM sys.dm_tran_locks WHERE request_status = 'WAIT';. Shorten transaction durations or reorder table updates to avoid circular blocking. - Improve Indexing: Ensure indexes support query patterns to reduce table scans and lock contention. The Missing Indexes Report in Database Health Monitor can help identify opportunities for optimization.
- Adjust Isolation Levels: Consider using Read Committed Snapshot Isolation (RCSI) to reduce locking conflicts, especially in high-transaction environments.
Real-World Impact
Imagine your application users reporting slow performance every morning at 9:00 AM. The Blocking by Hour Report reveals a 100% blocking spike during that hour. By investigating, you discover a poorly optimized ETL job running concurrently with user queries. Using Database Health Monitor’s tools, you optimize the job’s queries, add missing indexes, and reschedule it to off-peak hours, eliminating the bottleneck. This proactive approach saves time, reduces downtime, and keeps your users happy.
Why Database Health Monitor?
Developed by Stedman Solutions, Database Health Monitor is a powerful, affordable SQL Server monitoring tool designed to simplify performance diagnostics. The Blocking by Hour Report is just one of its many features, which include:
- Real-time monitoring of blocking, deadlocks, and Wait Statistics.
- Comprehensive reports for index fragmentation, missing indexes, and disk usage.
- Intuitive dashboards for CPU, memory, and I/O performance.
- Proactive alerts to catch issues before they escalate.
With over 13 years of development, Database Health Monitor is trusted by DBAs worldwide to maintain healthy, high-performing SQL Server environments.
Try Database Health Monitor Today
Don’t let blocking issues slow down your SQL Server. Download Database Health Monitor for free and start using the Blocking by Hour Report to uncover performance bottlenecks. Whether you’re troubleshooting existing problems or proactively optimizing your environment, this tool empowers you to take control of your SQL Server’s health. Visit StedmanSolutions.com to learn more or contact us for a free 30-minute consultation to discuss your SQL Server needs.
Call to Action: Take the first step toward a healthier SQL Server. Download Database Health Monitor now and explore the Blocking by Hour Report to optimize your database performance!